Why a “Blocked” step in your Value Stream is a bad idea!
As an Agile transformation consultant, I am required to support teams in very varied sectors of activity. A common practice that I find in many of these teams is the addition of a “Blocked” column on their activity tracking table (often in Jira).
The intention behind this column is to highlight tickets that are temporarily blocked, for one reason or another, which may seem like a good idea at first.
However, I think this approach poses flow management problems and can seriously harm the visibility of the work in progress.
In this article, I invite you to explore why this “Blocked” column can create inefficiencies and how Jira offers a more suitable solution thanks to the use of the Flagged field.
What’s the problem with the “Blocked” Column?
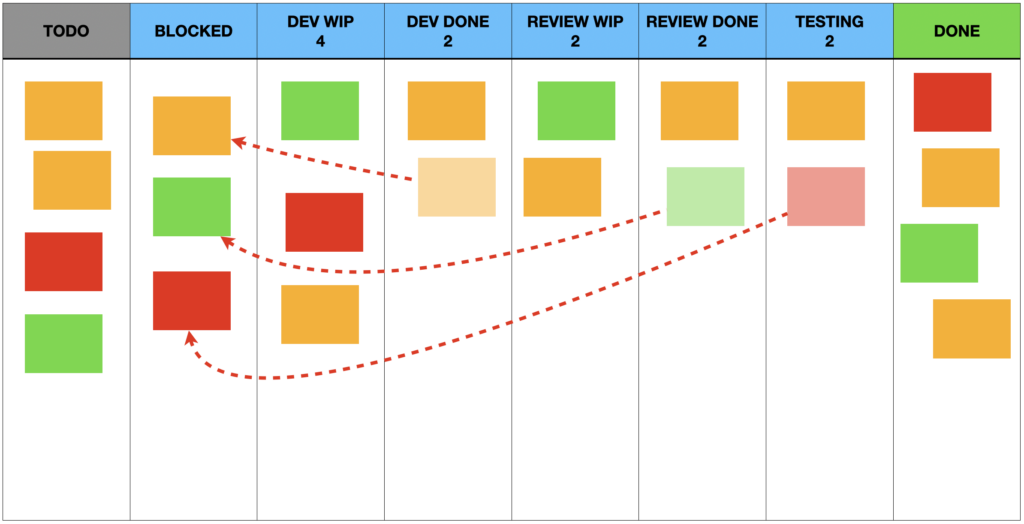
The creation of a “Blocked” step in the activity flow monitoring table of a team can represent, at first glance, a comfortable practice, allowing you to concentrate in the same place all the tickets that find themselves blocked in the Flow regardless of where they were identified.
However, this approach is misleading and can cause several problems.
- Disrupting Workflow Flow: Visualizing the status of your activity flow is an important element in managing your process. Moving blocked tickets to a single column takes tasks out of their current stage (e.g. “In Development”, “In Testing”, etc.), making it difficult to see where the blockage actually lies in the flow. This makes it harder to manage bottlenecks and can hide inefficiencies.
- Loss of Context: When a ticket is moved to a “Blocked” column, it loses the context of the process step it is in. The team no longer knows at which precise stage the blockage is (development, testing, validation, etc.), which makes it more difficult to identify systemic problems.
- Encourage Passive Behavior: Having a “Blocked” column can unintentionally encourage passive behavior within teams. If a ticket is blocked, it is moved to the column, but no clear action is defined to unblock the situation quickly. The blockage becomes less visible in the main flow, and there is a risk that it will be ignored until the situation is critical.
- Complicate Metrics: A “Blocked” column makes it more difficult to analyze flow metrics like Lead Time and Cycle Time because tickets artificially go through an extra step which has no reason to be. It also distorts measures of flow efficiency and makes it more difficult to spot opportunities for improvement.
Using the Flagged Indicator in Jira
If you need to manage your activities via the Jira application, it offers you a solution through the Flagged field.
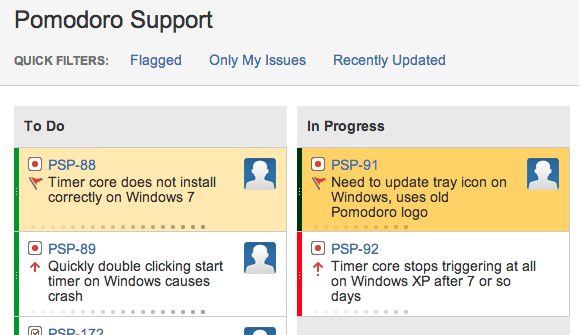
Flagged is a visual indicator for flagging blocked tickets or tickets deserving special attention, without removing them from their context, i.e. the stage of the flow where they are located.
Here is why using this indicator is preferable to a dedicated column:
- Maintaining Context: One of the major advantages of the “Flagged” indicator is that it allows you to mark a ticket as blocked, while maintaining it in its current stage of the process. This provides immediate visibility into where in the flow the blockages are (e.g. “In Development”, “In Testing”), making it easier to identify the root causes of outages.
- Increased visibility: The “Flagged” indicator in Jira displays a distinctive visual (usually a yellow color) that draws the team’s attention to tickets that require action. This system allows the team to continue to focus on the flow while keeping blockages clearly visible, without needing to move tickets to a separate column.
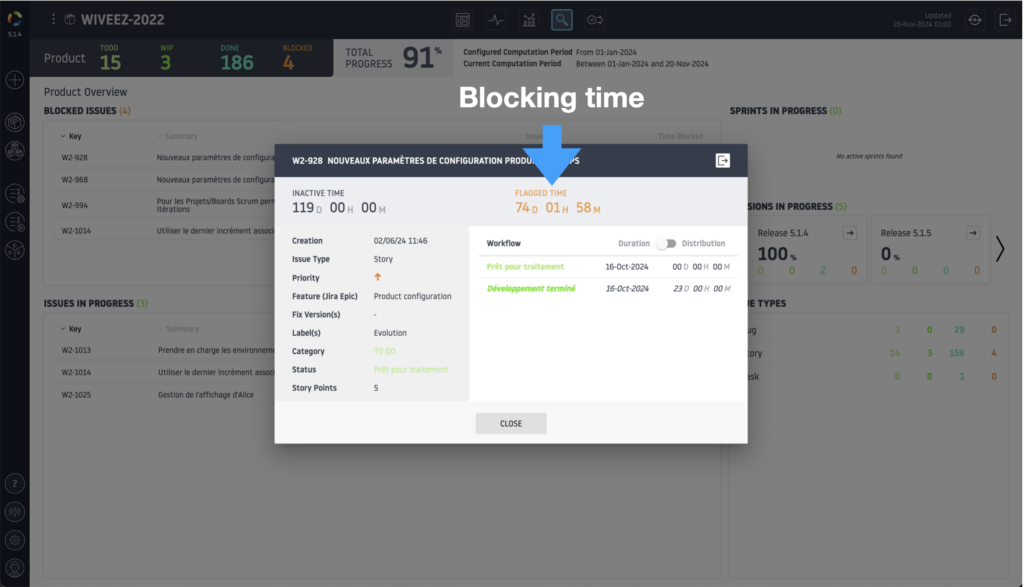
- Accurate Metrics: By using the “Flagged” indicator, the ticket remains in its normal flow, allowing accurate data to be captured on metrics like Lead Time and Cycle Time. The time spent blocked can still be measured using the start and end dates of the flag, without disturbing the rest of the flow metrics.
- Encourage Rapid Action: Flagging highlights blocked tickets without removing them from the flow, prompting the team to act more quickly to resolve blockages, while giving them a clear view of their overall progress.
How to Use “Flagged” in Jira to Manage Blocked Tickets
- Configure the “Flagged” indicator: Jira natively offers the “Flagged” option, but if it is not yet active in your project, you can easily configure it. Simply add the flag via the ticket options menu and select “Flag as Blocked” (or similar wording depending on how your Jira instance is configured).
- Create a Dynamic View of Blocked Tickets: Using the “Flagged” indicator, you can also configure Jira filters or dashboards that only list tickets marked as blocked. This allows blockages to be quickly viewed in a dedicated dashboard without disrupting the main flow.
Wiveez helps you track Blocked Tickets
For teams using Jira and looking to go further in tracking and managing blocked tickets, Wiveez offers an ideal solution.
This platform enriches the experience in the management of Flow Metrics and allows a more precise and detailed visualization of blocked tickets thanks to several specific tools:
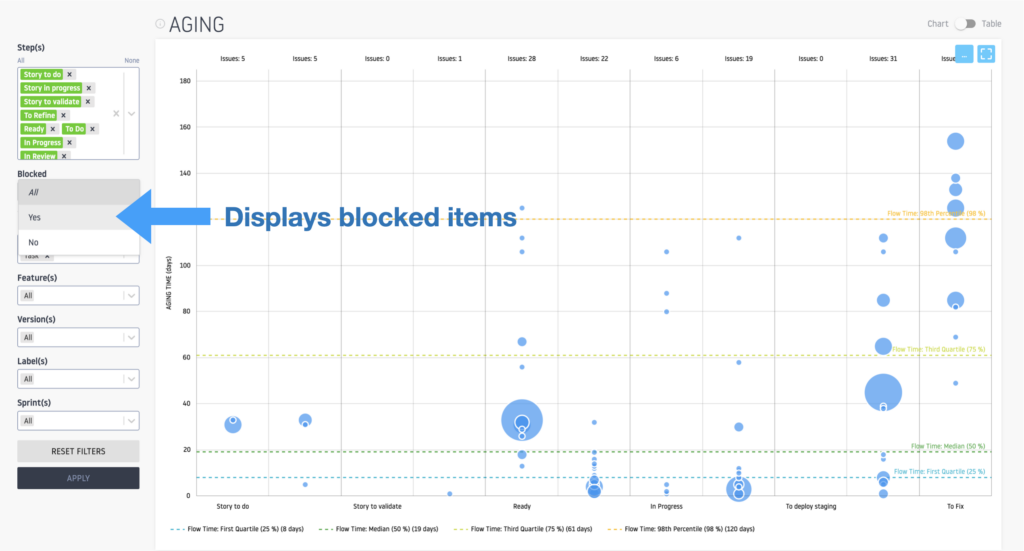
- The Aging Chart to Track Current and Blocked Tickets: Wiveez offers an Aging Chart which allows you to visualize the progress of tickets over time, highlighting those which are stagnant or blocked. By using Jira’s Flagged field, blocked tickets are clearly visible, allowing teams to quickly identify and resolve obstacles in the workflow.
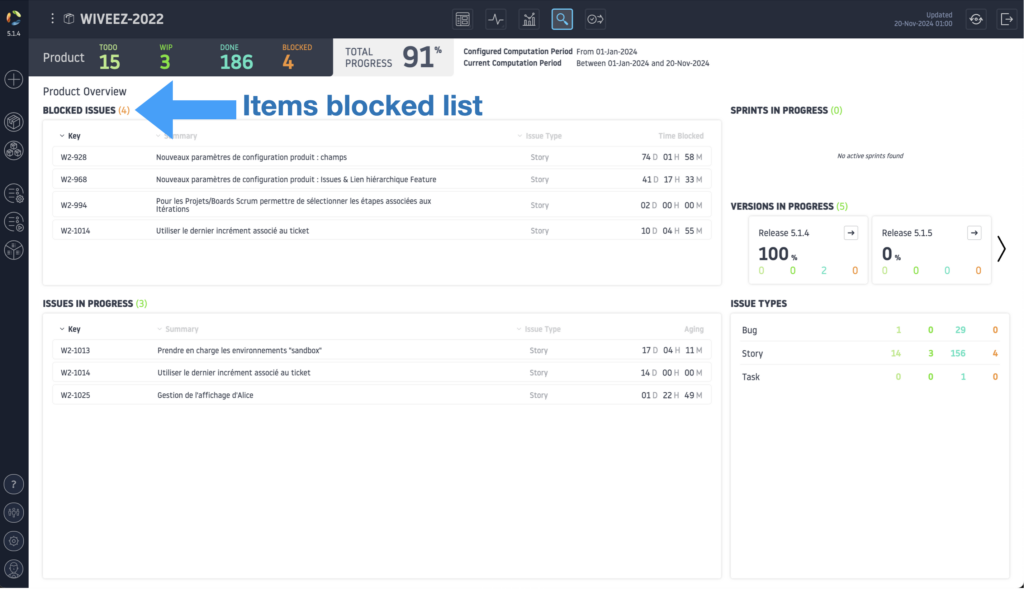
- Tracking Blocked Tickets in Backlogs: In each dashboard backlog (product, version, feature, etc.), Wiveez displays the number of blocked tickets. This direct visibility of blockages, without having to leave the main screen, allows for faster decision-making and proactive intervention by the team.
- Access to a Summary Page of Blocked Tickets: Wiveez goes further by offering users a dedicated summary page which brings together all the tickets blocked within a project. This global view allows the team to monitor all blocked tickets at a glance and prioritize the actions necessary to remove these obstacles.
- Visualization and Continuous Improvement: Using these Wiveez tools, teams can track not only where and when blockages occur, but also how long they last. This information is essential for identifying recurring bottlenecks, problematic dependencies, and areas for improvement in the workflow.
Take Away… Make Blockages a Priority
In your daily meetings (stand-up), ensure that blockages are at the heart of the discussion, in order to encourage the team to work collectively to resolve them.
For blockages requiring more in-depth analysis, do not hesitate to implement Lean practices.
A3 Problem Solving
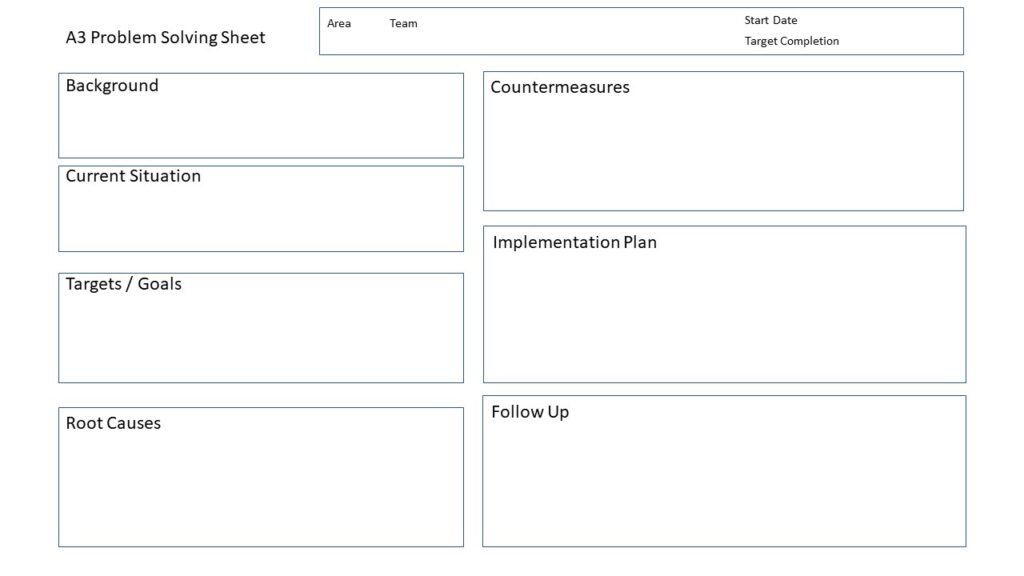
A3 Problem Solving is a structured method that takes its name from the A3 paper size used to document the process. It is a powerful tool for analyzing and resolving problems while ensuring collective alignment around the actions to be taken.
The Key Steps of A3 Problem Solving:
- Define the problem: It is crucial to identify the problem clearly and precisely. This step allows you to understand the impact on the objectives of the team or organization.
- Analyze the current situation: Visualizing the current process or system is important to fully understand where the problem lies. We often use tools like Value Stream Mapping.
- Set goals: By identifying targets, the team is clear on what outcome is expected after solving the problem.
- Root cause analysis: Using tools like the 5 Why’s or the Ishikawa diagram (or cause and effect diagram), the team seeks to understand the root cause of the problem.
- Propose solutions: Based on the root cause analysis, the team proposes solutions to eliminate the problem.
- Action plan: Solutions are translated into concrete actions, assigned to managers and accompanied by deadlines.
- Monitoring and adjustment: After implementing the actions, the team evaluates the results and adjusts the actions if necessary. The idea is to ensure that problems are resolved sustainably.
The A3 is not simply a document, but a collaborative process that helps improve communication, align teams on actions, and ensure that obstacles are addressed in an effective and sustainable manner.
The 5 Why’s
The 5 Why’s technique is a simple and effective method for discovering the root cause of a problem. It consists of asking the question “Why?” » five times (or as many as necessary) in order to dig into each answer and get to the heart of the problem.
Example :
- Problem: “The development of a feature has fallen behind schedule. »
- For what ? Because the task was blocked for two days.
- For what ? Because key information was missing.
- For what ? Because the supplier did not respond in time.
- For what ? Because the request was not clearly communicated to the supplier.
- For what ? Because our process for requesting external information is not standardized.
The technique helps to go beyond a superficial explanation, but to identify systemic problems and correct them.
The Ishikawa Diagram (or Cause and Effect Diagram)
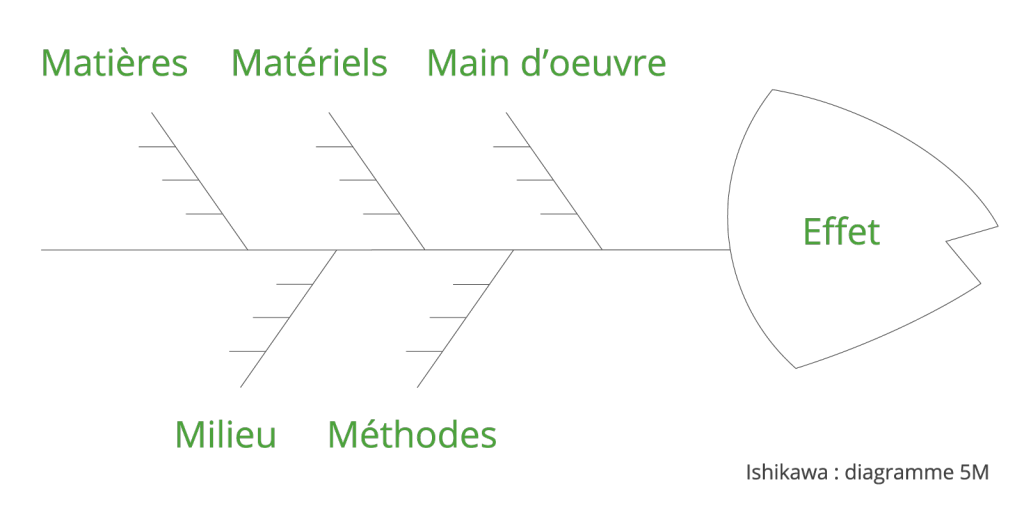
Also called a fishbone diagram, the Ishikawa diagram is a visual tool that helps map the potential causes of a problem. It is often used in addition to the 5 Why’s to explore and organize different categories of causes.
The causes are generally grouped into six main categories:
- Methods (process),
- Labor (people involved),
- Machines (tools, technologies),
- Materials (inputs used),
- Environment (environment, conditions),
- Measurements (indicators, data).
The Ishikawa diagram helps structure thinking and explore the different causes that can lead to an obstacle or problem.
Conclusion
Adding a “Blocked” column to a tracking table may seem like a simple solution for reporting blocks, but it tends to complicate workflow management and distorts performance metrics.
Using the Flagged indicator in Jira helps maintain clear visibility into blocked tickets without disrupting their natural flow, while making it easier to analyze blockages and encourage rapid action.
Thanks to tools like Wiveez, you can effectively track blocked tickets, visualize their impact on your flow through graphs such as the Aging Chart, and access a summary page that centralizes all blocked tickets in a project.
This advanced and transparent monitoring allows you to continually improve the performance of your team and ensure a smooth and optimized workflow.


