


Have you launched a large-scale enterprise transformation through the implementation of the SAFe Framework, a Feature Team organization or any other framework?
Wiveez allows you to generate your program level indicators (multi-teams) and provides you with the complete range of Flow performance monitoring.
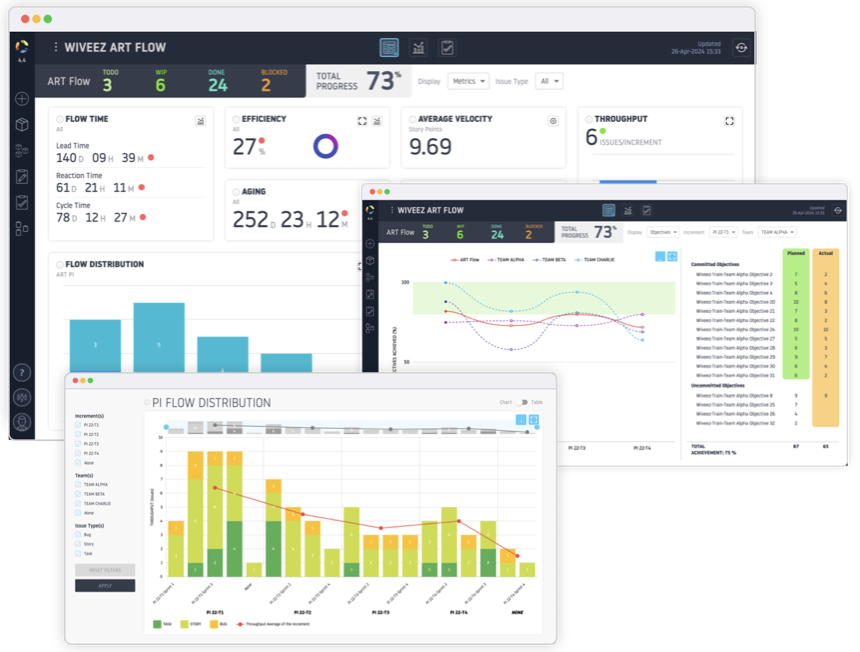
DASHBOARD
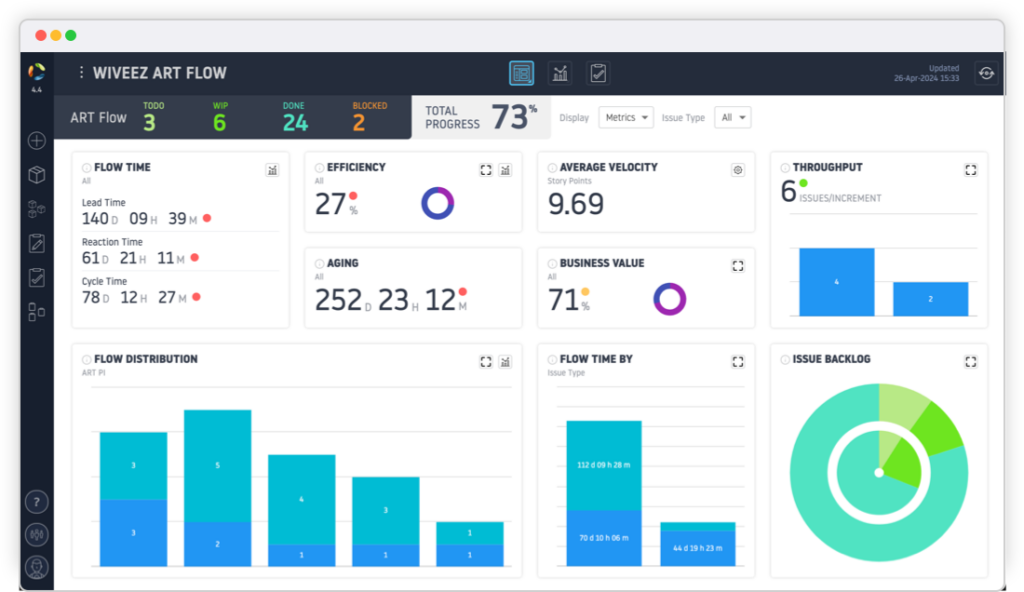


ART FLOW DASHBOARD
Allows you to monitor the performance indicators of the Flow, at the program level:
- Distribution of request flow;
- Aging of requests; Average velocity Multi-team Scrum;
- Business value generated;
- Average throughput/increment by request type;
- Track tickets by priority;
- Monitoring the distribution flow of program level requests (Feature, …) by increment;
- Monitoring of Flow Time, by type of program level request (Feature, etc.).
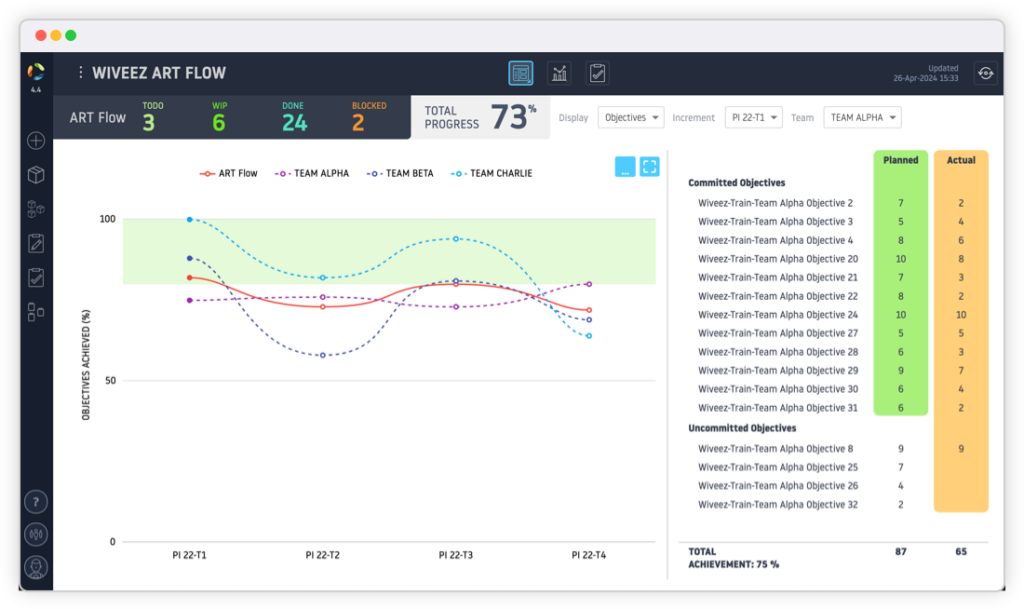
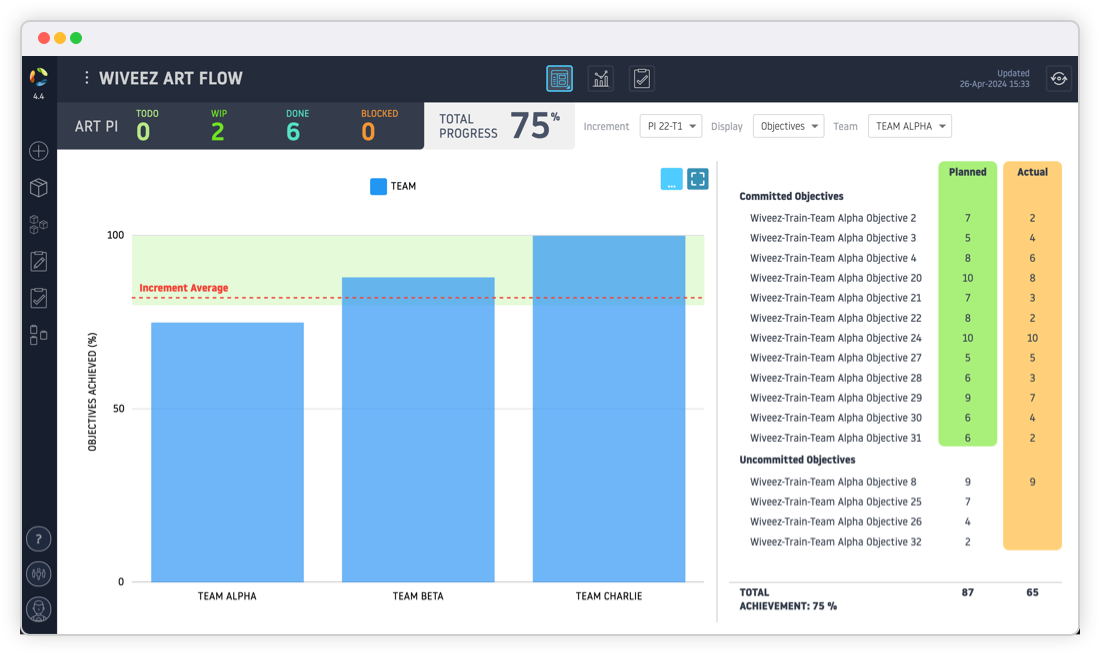
ART FLOW OBJECTIVES
Allows you to monitor the achievement of ART FLOW Objectives, by Increment and by Team.
Monitoring the Objectives makes it possible to identify whether the expectations of the business in terms of value generated on the Product are achieved and thus define the capacity of the program to meet its business commitments.
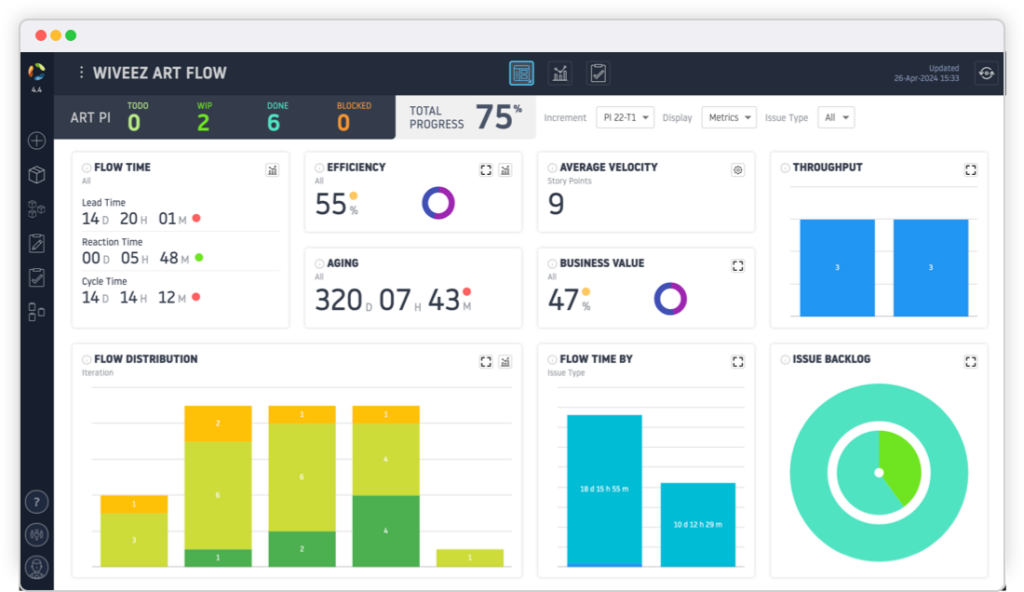
ART PI DASHBOARD
Allows you to monitor the performance indicators of the Flow, at the level of a Program Increment:
- Program ticket flow, by request type;
- Aging of requests; Average velocity Multi-team Scrum;
- Business value generated;
- Average throughput/increment by request type;
- Tracking requests by priority;
- Monitoring the distribution flow of program level requests (Feature, …) by increment;
- Monitoring of Flow Time, by type of program level request (Feature, etc.).
ART PI OBJECTIVES
Allows you to monitor the achievement of the objectives of an Increment of the program, by Iteration and by Team
Monitoring the Objectives makes it possible to identify whether the business expectations in terms of value generated on the Product are achieved and thus define the capacity of each Increment to meet its business commitments.
ART FLOW CHARTS
Wiveez provides you with a set of graphs for monitoring and analyzing the performance of the value flow of your ART FLOW.
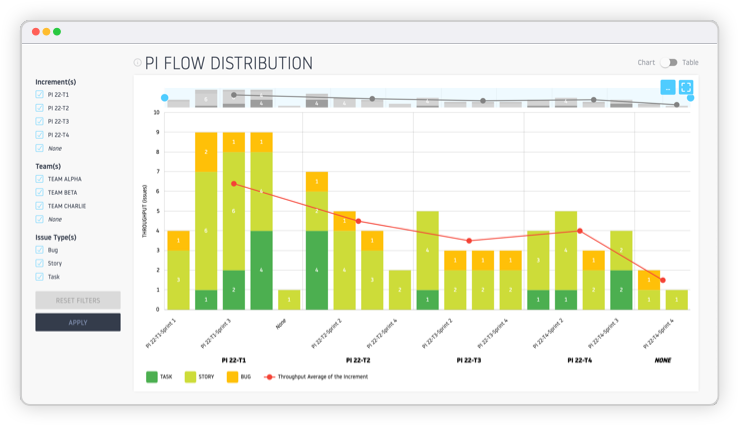
Distribution Flow by Increment
Analyze the distribution of your requests, by Increment and by Iteration.
This graph makes it possible to analyze the variation in the processing of consolidated requests across all program teams.
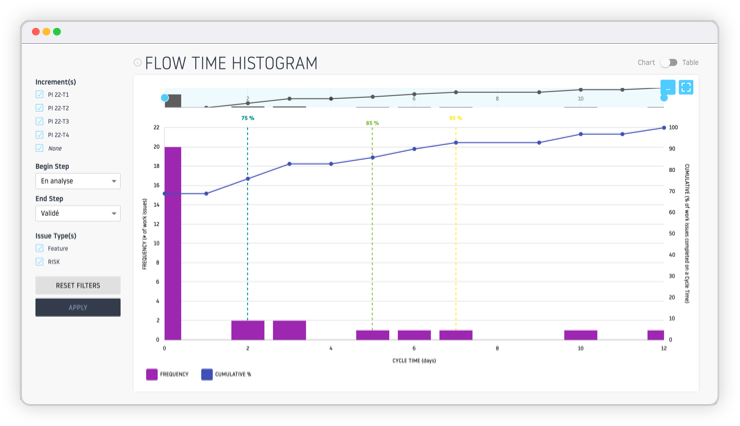
Flow Time Histogram
Represents the distribution of time required to complete the work items in your ART Flow.
This type of visualization helps detect deviations from expected performance standards and target improvements to reduce delays and optimize processes.
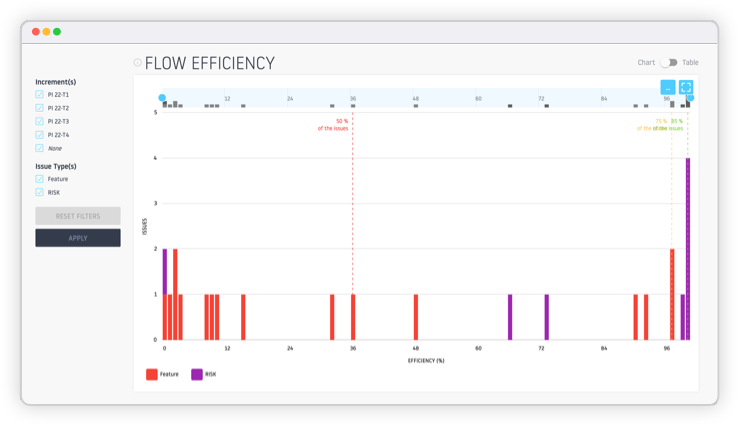
Flow Efficiency
Analyze the relationship between active time working on a task and total flow time, from start to completion of the task.
This metric allows you to evaluate the efficiency with which time is used in the process, distinguishing between productive time and waiting or inactivity time.
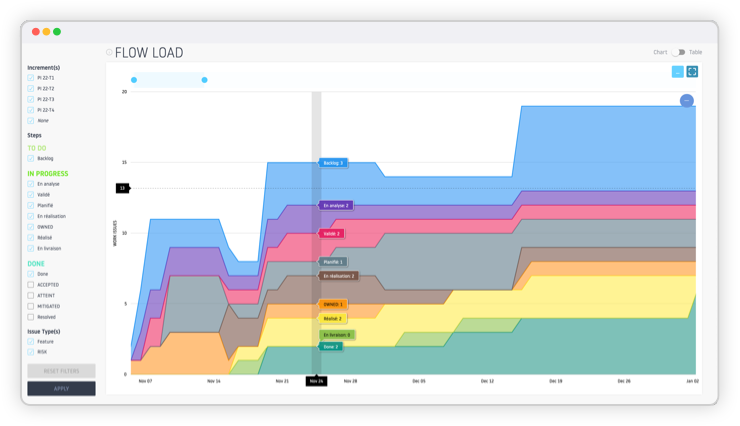
Cumulative Flow Diagram (CFD)
Visually represents the amount of work in different stages of a process, over a given period of time.
CFD helps identify bottlenecks, assess process capacity, and adjust workload to maintain consistent and efficient flow.
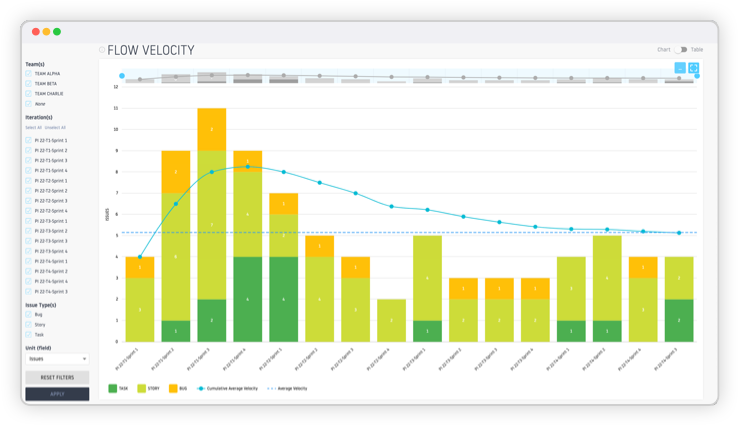
Flow Velocity
Monitor and analyze the velocity generated on iterations of the program, consolidated across all teams.
This graph allows you to analyze the performance and predictability of teams.
Wiveez provides you with filters to accurately analyze the performance of your program.
« Wiveez gave us insight into our agile metrics […] while allowing us to identify different levers for improvement. »
GUILLAUME BERTRAND
ScrumMaster Leader
SNCF Connect