


New Version Wiveez 5.0: Revolutionize the monitoring of your Flow Metrics and your Assessments with Advanced Features!
Dear users,
We are delighted to announce the launch of version 5.0 of Wiveez, your essential tool for monitoring and analyzing Flow Metrics in your JIRA projects, as well as in the management of Assessments.
This new version is designed to significantly improve the flexibility, customization, and predictive analysis of your project data.
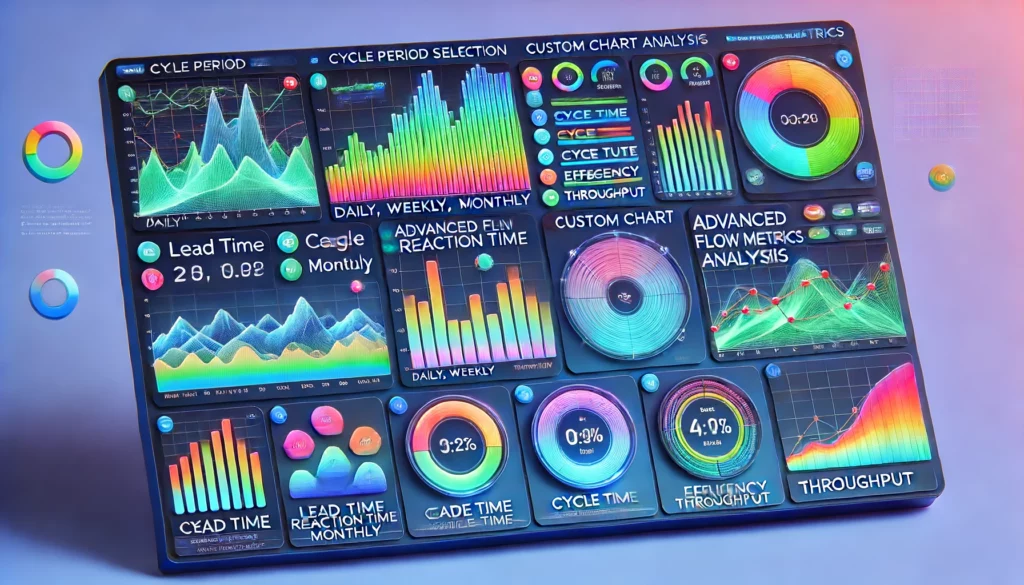
Track your flow by period cycle
Adapt your flow monitoring according to your specific needs.
Whether daily, weekly, by 2-week cycle, 3-week cycle or annually, you can now view your data over personalized periods, directly on your dashboards and in your monitoring graphs.
Create your own tracking charts using the “Custom Charts” feature
Unleash your creativity with the “Custom Chart” function.
Create custom charts based on any JIRA data, standard or custom.
Choose from column, line, or circle charts, in one or two dimensions, for a visual analysis that suits you.
Advanced Analysis of Flow Metrics & Integration of Thin-Tailed and Fat-Tailed Calculations
Our complete redesign allows you to perform detailed analyzes of Flow Metrics using quartiles, identifying ticket distribution and anomalies. Additionally, new predictability analysis helps you understand the nature of Thin-Tailed or Fat-Tailed distributions in your streams.
All your tracking charts now incorporate these analyses, enriching your understanding of project dynamics.
Consolidation of Multi-Team Assessments
Federate evaluation data from several teams for a global and comparative vision, thus strengthening the overall strategy of your organization.
Wiveez 5.0 is more than an update – it’s a transformation in how you manage agility at scale. Get ready to explore these new possibilities that pave the way for more precise and adaptive management of Flow Metrics and Assessments.
Thank you for your trust and enjoy discovering version 5.0!